In the UK’s competitive digital landscape, a perfectly polished Instagram profile is no longer a luxury—it’s a fundamental requirement for business growth. With 33.4 million users nationwide and 81% of UK retailers leveraging the platform, Instagram is a primary driver for product discovery and sales. However, visibility alone doesn’t guarantee conversions. The journey from a casual scroll to a confirmed purchase hinges on a strategic, optimised profile that actively guides visitors toward a goal.
This guide moves beyond guesswork and generic advice. We will detail a systematic, data-led approach to A/B testing every critical element of your Instagram profile. By treating your profile picture, bio, highlight covers, and grid layout as variables in a continuous optimisation experiment, you can dramatically increase your rate of converting profile visitors into loyal customers.
For many, building the foundational audience to test with is the first hurdle. If you’re starting out, understanding how to get more followers on Instagram is essential to gather meaningful data for the optimisation process we’ll outline.
Table of Contents
- Why a Data-Led Approach is Non-Negotiable
- The A/B Testing Framework: Your Blueprint for Optimisation
- Element 1: The Profile Picture – Your Digital Handshake
- Element 2: The Bio – Your 150-Character Pitch
- Element 3: Highlight Covers – Your Profile’s Navigation Menu
- Element 4: The Grid Layout – Your Visual Storyboard
- From Testing to Transformation: Implementing Your Wins
Why a Data-Led Approach is Non-Negotiable
Successful Instagram marketing in 2025 is driven by analytics, not intuition. The platform’s algorithm prioritises content that sparks meaningful, quick interactions such as saves, shares, and direct message replies. Every part of your profile should be engineered to trigger these positive “signals.”
The UK social commerce market is projected to more than double, reaching £16 billion by 2028. To capture a share of this growth, your profile must function as a seamless, high-converting storefront. This means making data-driven decisions to reduce friction and build trust at every touchpoint, a principle confirmed by a 2025 survey of established e-commerce merchants.
Also Read
The A/B Testing Framework: Your Blueprint for Optimisation
Before diving into specific elements, you must adopt a testing mindset. A/B testing, or split testing, involves comparing two versions of a single variable to see which performs better against a specific goal. The key is to test one change at a time.
Here is the foundational process you’ll use for each profile element:
- Define Your Goal & Metric: What action do you want to inspire? (e.g., Profile visits, website clicks, DM enquiries). Choose the corresponding metric to track.
- Develop a Hypothesis: Based on insight or industry knowledge, make a prediction (e.g., “A profile picture featuring our founder will increase profile visits because it looks more personal”).
- Create Two Versions (A & B): Change only the variable you are testing.
- Run the Test & Gather Data: Allow the test to run long enough to collect statistically significant data—typically at least a week.
- Analyse Results: Use Instagram Insights to see which version drove better performance toward your goal.
- Implement & Repeat: Adopt the winning variant and begin testing a new hypothesis.
Element 1: The Profile Picture – Your Digital Handshake

Your profile picture is often the first visual impression you make, both in the feed and on your profile. It needs to be instantly recognisable and build trust.
What to Test:
- Logo vs. Personal Photo: Does your audience connect better with your brand symbol or a human face?
- Close-up vs. Environmental Shot: If using a personal photo, test a tight headshot against a shot in a relevant setting (e.g., in a workshop, at an event).
- Colour Background vs. Natural Background: Which better captures attention and aligns with your brand feel?
Key Metric to Track: Profile Visits. A compelling profile picture can stop a scroll and prompt a user to click through to your profile.
Pro Tip: Ensure your image is high-resolution and adheres to the correct size (320×320 pixels), keeping the key element centered as it displays in a circle.
Element 2: The Bio – Your 150-Character Pitch

Your bio must communicate your value, establish credibility, and direct traffic in seconds. It’s a powerful conversion tool.
What to Test:
- Value Proposition: Test different benefit-oriented statements. Does “Sustainable skincare for sensitive skin” perform better than “Handmade, natural beauty products”?
- Call to Action (CTA): Experiment with different CTAs and their placement. “Shop our latest collection” vs. “Join our community for exclusive tips.”
- Emoji Use: Does strategic use of emojis to break up text improve readability and click-through rates?
- Link Tool: Test different offerings in your link-in-bio tool (like a direct shop link vs. a “link tree” to multiple resources).
Key Metrics to Track: Website Clicks (from your bio link) and Follows. Monitor which bio version leads to more actionable engagement.
Element 3: Highlight Covers – Your Profile’s Navigation Menu

Highlights are permanent story galleries that sit prominently below your bio. Their covers act as a visual navigation system, directing visitors to your most valuable content.
What to Test:
- Design Approach: Test custom-designed icons for a polished look against authentic story screenshots for a behind-the-scenes feel.
- Colour Psychology: Do covers with warm colours (like red/orange) attract more clicks than cool colours (blue/green) for certain content types?
- Label Clarity: Test straightforward text labels (e.g., “Tutorials,” “Reviews”) against more abstract icons.
Key Metric to Track: Highlight Taps. Use Instagram Insights to see which cover sets are most effective at getting users to explore your saved content.
Design Specifications: For optimal quality, create covers at 1080 x 1920 pixels with a 9:16 aspect ratio, keeping critical design elements within the central safe zone.
Element 4: The Grid Layout – Your Visual Storyboard
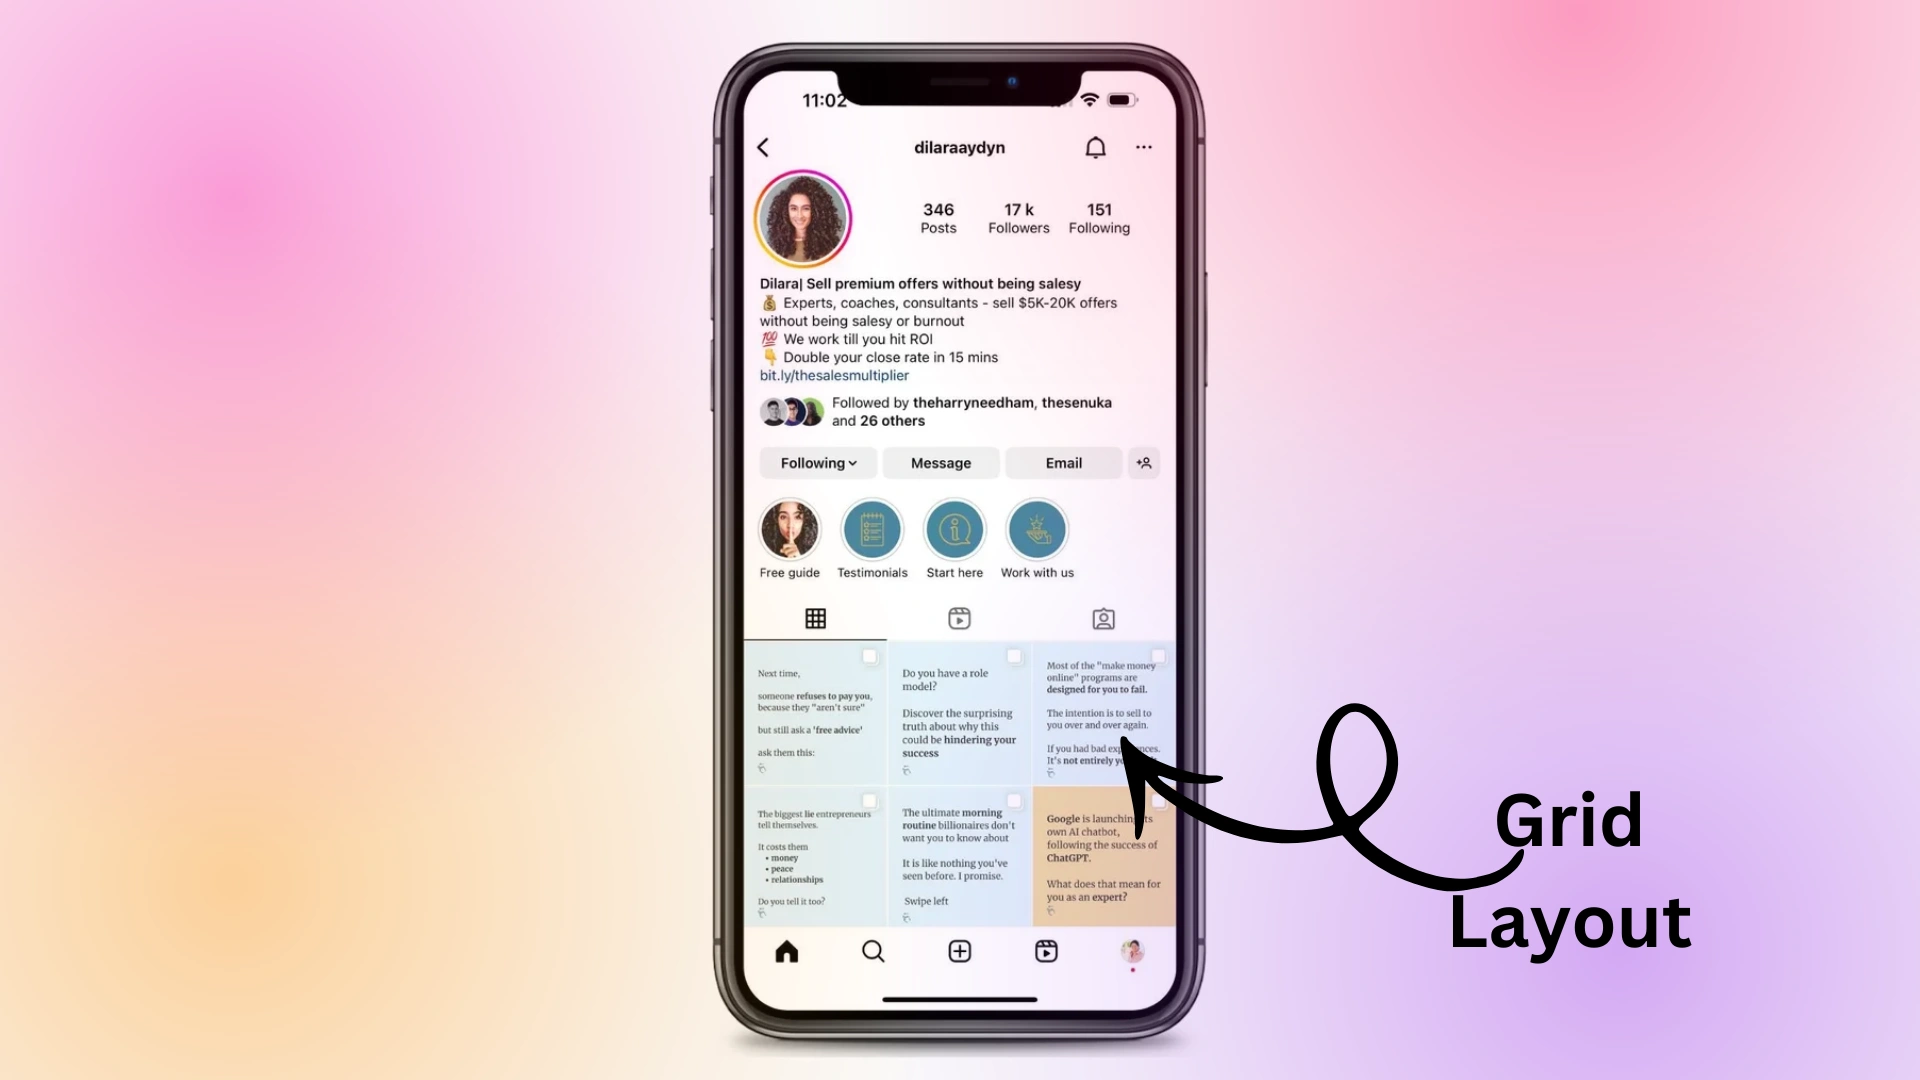
Your overall feed aesthetic creates a crucial first impression. A cohesive grid can tell a brand story and encourage profile exploration.
What to Test:
- Content Format Mix: Your choice of post format—Reels, Carousels, or single images—has a major impact on reach and conversion. The table below shows how different formats perform, which should guide your testing strategy.
| Content Format | Average Reach | Best Use Case | Conversion Rate |
| Reels | 37.9% | Discovery & viral reach | 2-4% |
| Carousels | 14.5% | Education & deep engagement | 2.5-3.5% |
| Stories | 1.6% (avg. reach) | Direct conversion & urgency | 3-5% |
Source: Analysis of Instagram format performance
- Patterning vs. Balanced Variety: Test a strict colour or layout pattern against a more varied, but still on-brand, aesthetic.
- Hook Placement in Reels: Test different opening hooks in the first 1-3 seconds of your Reels to see which yields higher retention and, ultimately, more profile visits.
Key Metrics to Track: Overall Engagement Rate, Saves, and Shares. A strong grid should increase these metrics, indicating your content is resonating and encouraging deeper interaction.
From Testing to Transformation: Implementing Your Wins
Optimisation is a cycle, not a one-time task. Once you’ve identified a winning profile picture, bio, or cover style, implement it. However, your work isn’t done. Consumer preferences and platform algorithms evolve.
Schedule quarterly audits of your profile performance. Revisit your hypotheses, and use the deep analytics available in Meta Business Suite to understand the full customer journey—from which post led to a profile visit, to which highlight then triggered a website click.
By adopting this meticulous, data-informed approach, you transform your Instagram profile from a static page into a dynamic, high-converting asset. This level of strategic optimisation is what separates growing brands from stagnant ones in the crowded UK digital market. It’s the same rigorous, analytical methodology professional growth services use to scale audience and conversion rates—applied directly to the foundation of your Instagram presence.